India Cybercrime Arrest Trends by State
High case counts mask which states actually arrest criminals and where enforcement genuinely works.
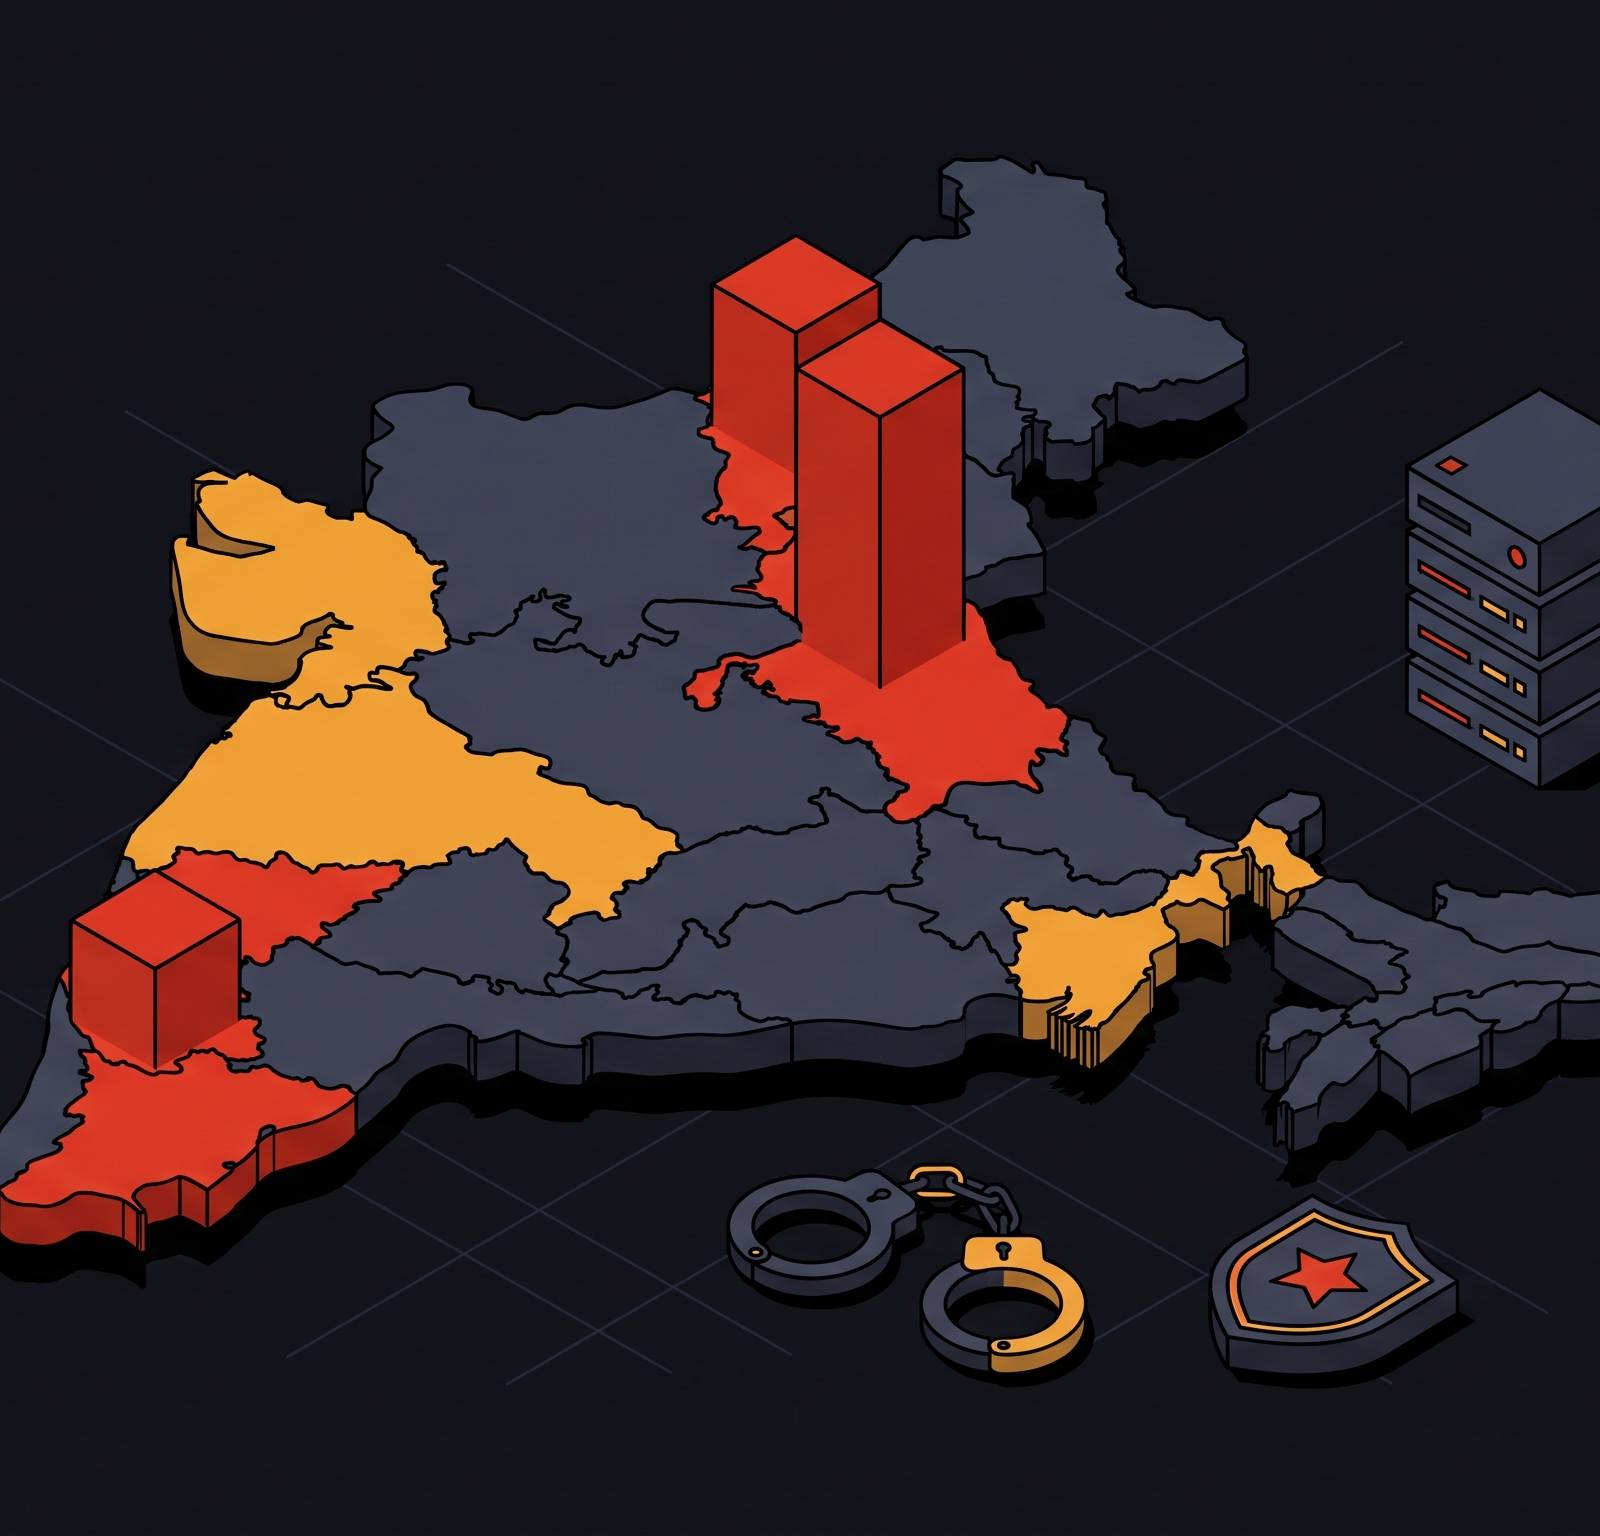
India crossed a milestone in 2024: over one lakh cybercrime cases registered in a single year. That's a real number, from a real dataset (NCRB Crime in India 2024), and it got a lot of headlines. But here's the thing. That number, on its own, leaves the real questions unanswered: where cybercrime is actually happening, which states are doing something about it, and whether any of this enforcement activity is working. The headline figure is a starting point — and like an iceberg, what's visible above the surface is the least interesting part.
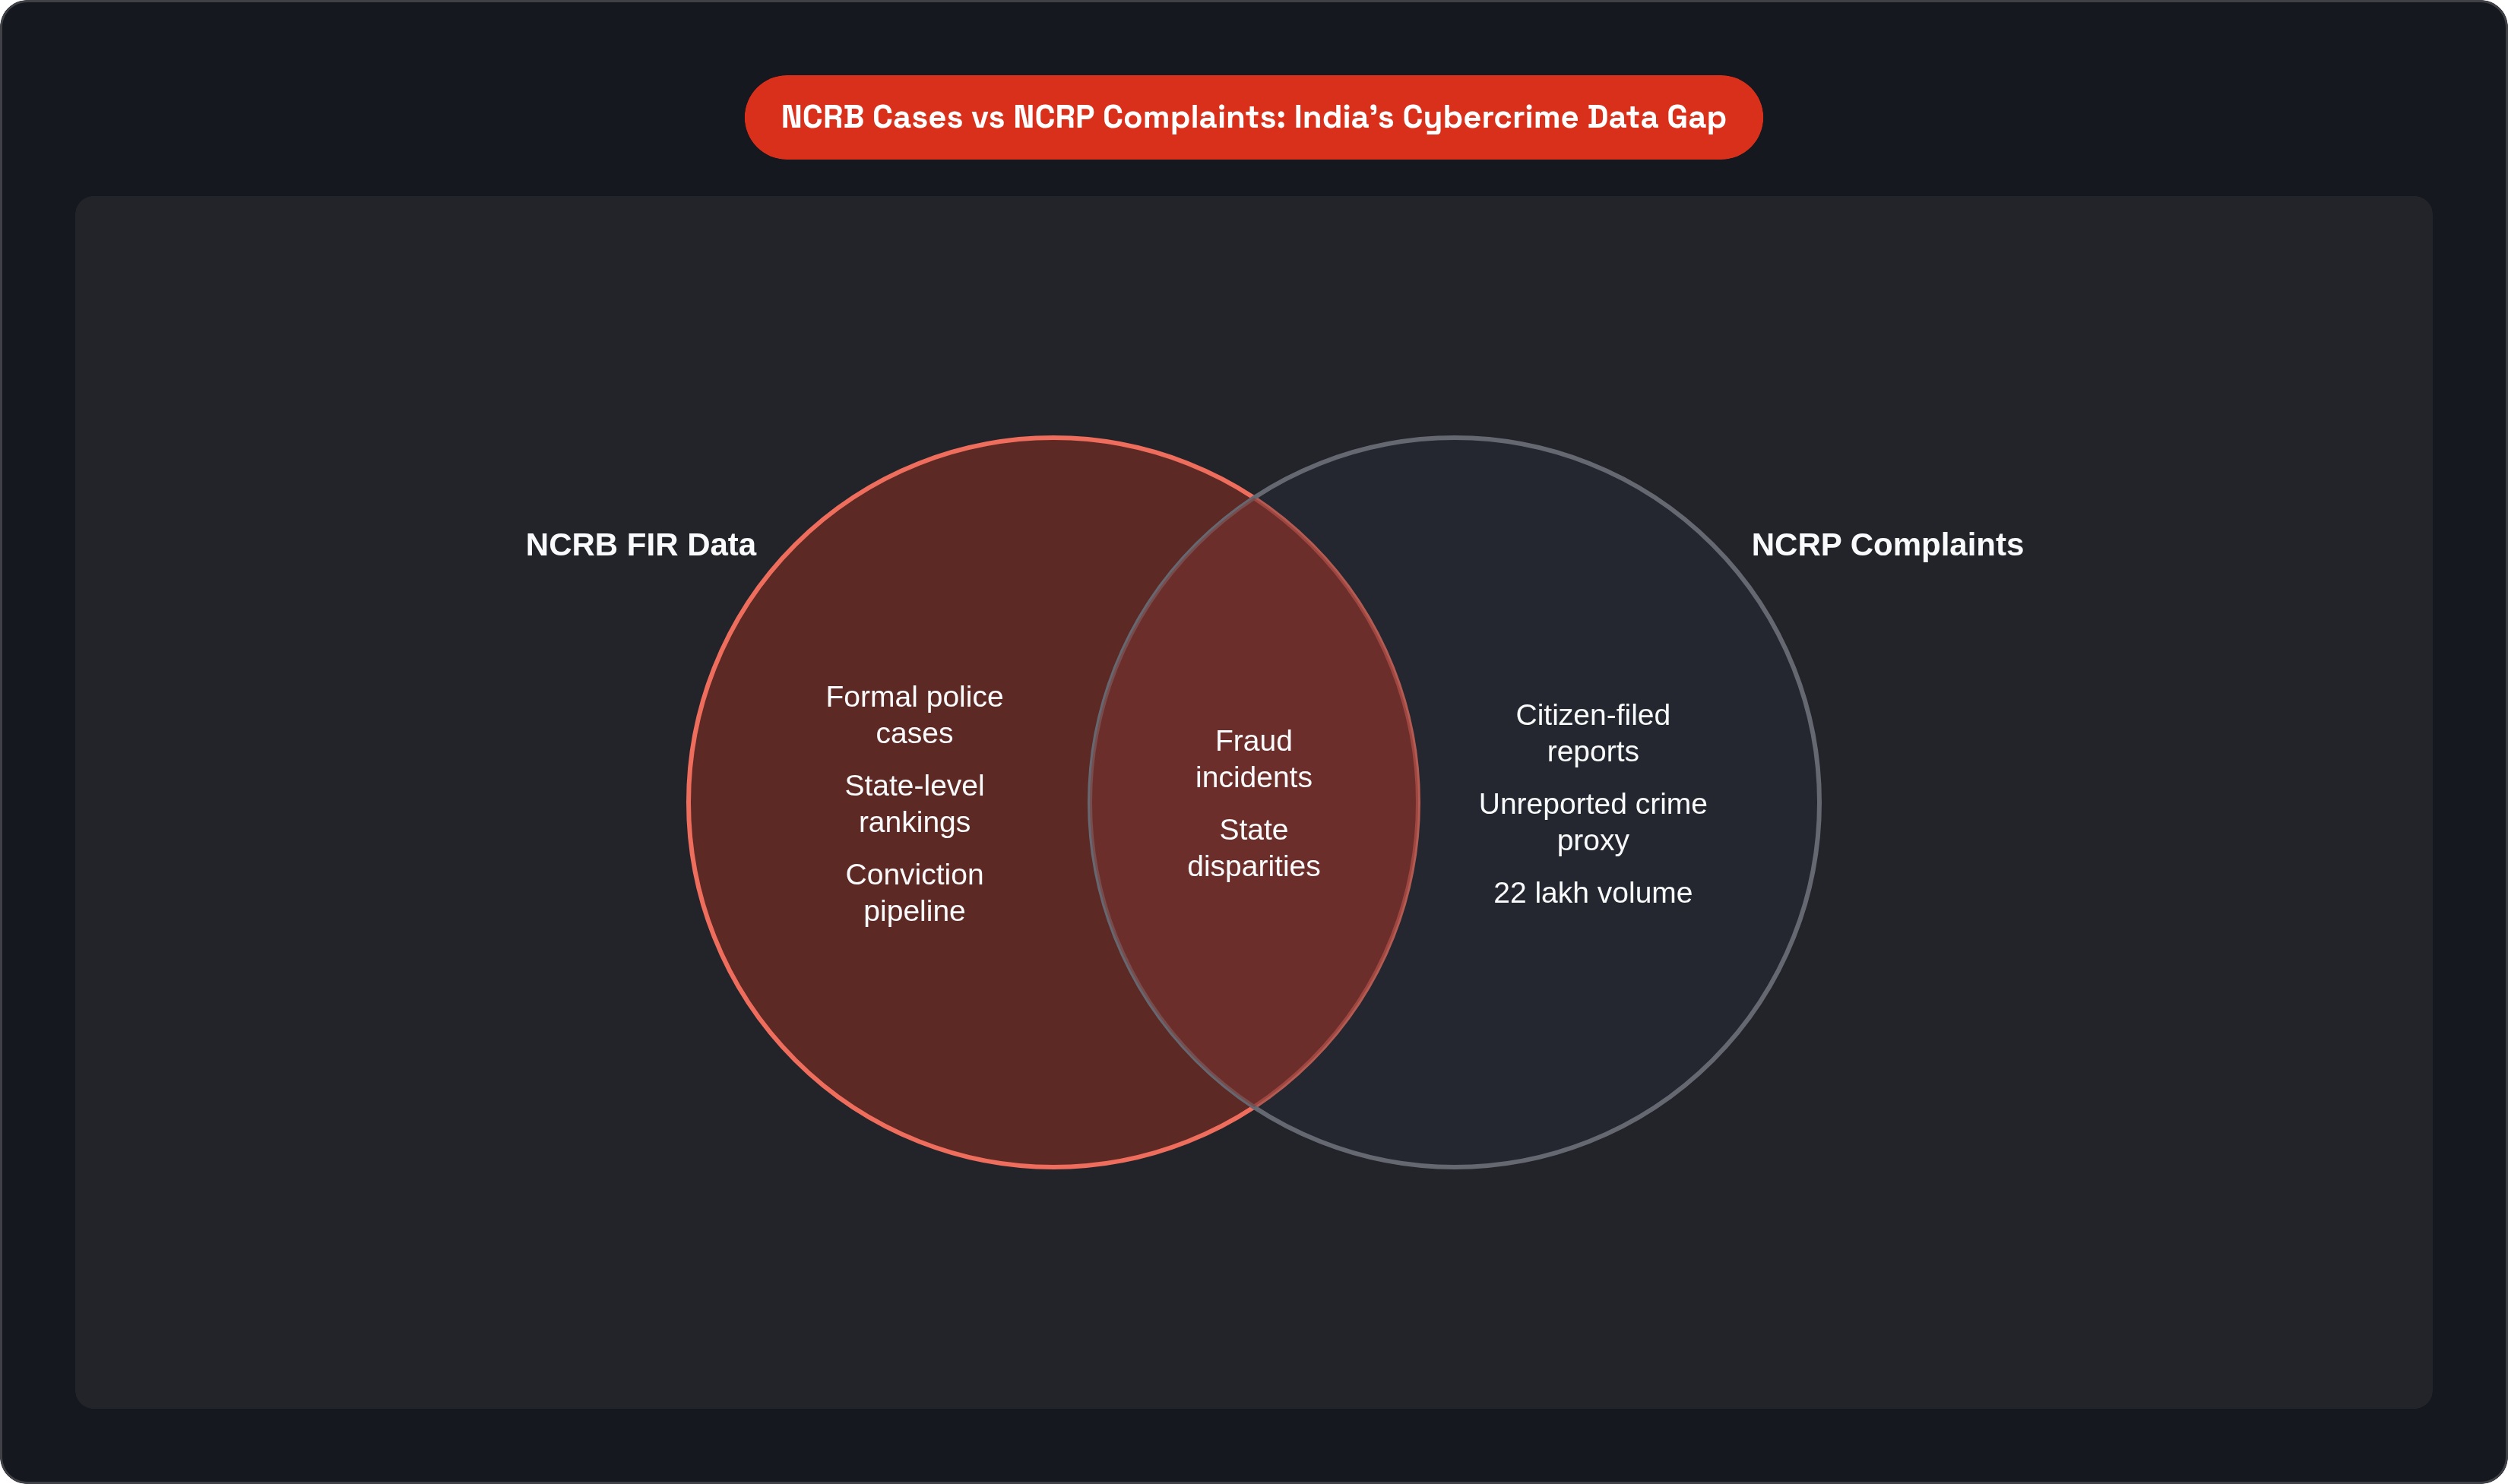
There's also a parallel dataset that makes things messier. The NCRP complaint portal recorded over 22 lakh complaints in 2024. That's a 22-fold gap from the NCRB figure. One tracks formal FIRs filed with police; the other tracks citizen reports submitted online. Conflating them produces nonsense. Keep them separate, and they become useful.
The 17.9% rise in registered cases is real. But it's blunt. It leaves hidden which states are driving it, which are quietly under-registering, and which are actually arresting people. To understand India's enforcement picture, you have to disaggregate. That's what this piece does.
Telangana and Karnataka Are at the Top. Here's What That Actually Means.
Telangana recorded the highest number of registered cybercrime cases in 2024 at 27,230. That's a nearly 50% rise from the previous year. Karnataka followed with 21,003 cases. Telangana's rate works out to over 70 cases per lakh population. The highest of any state.
Before you read that as "Telangana has the worst cybercrime problem in India," pump the brakes.
High case counts in these states partly reflect larger digital economies and better registration machinery. Not necessarily higher victimisation rates. Maharashtra and Karnataka host major commercial and IT hubs where online fraud concentrates. But they also have the infrastructure to convert complaints into FIRs. Many states simply don't.
This is the core interpretive problem with raw case counts:
A state with functional cyber police stations registers more cases.
A state without that infrastructure registers fewer cases, because fewer FIRs get filed regardless of underlying crime volume.
Case volume is a function of both crime and institutional capacity, mixed together, inseparable at the aggregate level.
So when Telangana tops the NCRB rankings, it tells you Telangana has a functioning registration system and a significant digital economy. The ranking reflects better counting — like a hospital that diagnoses more illness not because its town is sicker, but because it actually has doctors.
The Complaint-Volume States That Don't Match the FIR Picture
Here's where the NCRP data gets interesting. Maharashtra led NCRP complaint volumes in 2024 with 3.03 lakh complaints. Uttar Pradesh was right behind at 3.01 lakh. Karnataka came third at around 1.7 lakh. Several other states crossed the one-lakh complaint mark: Gujarat, Delhi, West Bengal, Telangana, Tamil Nadu, Rajasthan, Haryana.
UP's raw complaint volume makes sense. It's the most populous state in the country. But rate-adjusted, and compared against its conversion of complaints into formal cases, a very different picture emerges.
Rajasthan is the one that really stands out. State police data showed around 7.5 lakh complaints related to cyber fraud in 2024 alone. That is an enormous number. And it sits in stark contrast to Rajasthan's formal NCRB registered case count.
The gap between complaints and FIRs varies widely across states. Where the gap is widest, it signals one of two things. Either deliberate under-registration (a police station choosing not to formally log a complaint as a case) or capacity failure (they want to, but don't have the people, tools, or process to do it). Often both.
The complaint-to-FIR gap is the closest proxy available for unreported cybercrime. It is imperfect and the most honest signal we have.
The Hotspot Geography: Where Organised Cybercrime Actually Lives
Case counts by state are one layer. But the more operationally useful picture comes from geography at the district level. The Union Government formally designated seven Joint Cyber Coordination Team (JCCT) regions as concentrated cybercrime clusters: Mewat (Haryana), Jamtara (Jharkhand), Ahmedabad, Hyderabad, Chandigarh, Visakhapatnam, and Guwahati.
Each carries a distinct crime profile:
Jamtara (Jharkhand): KYC scams, credit-card reward-point fraud. Became so notorious it got a Netflix series.
Mewat (spanning Haryana's Nuh district, parts of Rajasthan's Bharatpur, and UP's Mathura): Sextortion rackets, hotel-booking scams.
Rajasthan's Jodhpur and Barmer, plus parts of Gujarat, West Bengal, and Madhya Pradesh: Major mule-account supply centres used to move stolen funds.
And then there's the transnational dimension. Nearly half of cybercrime incidents in 2024 were linked to fraudsters operating from Southeast Asian countries, specifically Myanmar, Cambodia, Vietnam, Laos, and Thailand, per I4C data. So the hotspot geography is partly domestic clusters and partly overseas operations using Indian infrastructure.
The JCCT designation determines which districts get coordinated multi-state enforcement attention. That feeds directly into arrest numbers. Which brings us to the messy part.
What the Arrest Figures Actually Show. And Where They Go Dark.
I4C's Pratibimb geospatial module has facilitated over 29,837 arrests nationally and supported more than 2.33 lakh cyber investigation assistance requests. That figure represents a sharp jump from roughly 16,840 arrests the same system had enabled as recently as late 2025.
Some state-level operations give a sense of scale:
Jharkhand: Over 400 arrests in a single month during the Jamtara operation, with documented evidence of declining offence volumes from that area afterward.
Haryana: 42 arrests in two days in Nuh, Mewat. Pratibimb identified 594 cyber fraudsters statewide, with about 18% of those cases tracing back to areas around Nuh and neighbouring Alwar in Rajasthan.
Rajasthan: Operation Anti Virus registered more than 150 FIRs and arrested more than 400 fraudsters from a single village.
These are impressive numbers for targeted operations. But here's the structural problem with drawing broader conclusions. Specific aggregate arrest totals disaggregated by state for 2024 are not publicly released as a single clean table. They appear in NCRB annexures, parliamentary question responses, and press releases. Scattered. Hard to compile. Harder to compare.
Jharkhand and Haryana are mid-tier in NCRB case volumes yet represent some of the most intensive enforcement action in the country, because enforcement there targets organised clusters rather than diffuse fraud activity.
That mismatch is the whole story, really.
Why High Case Volumes Rarely Produce Convictions
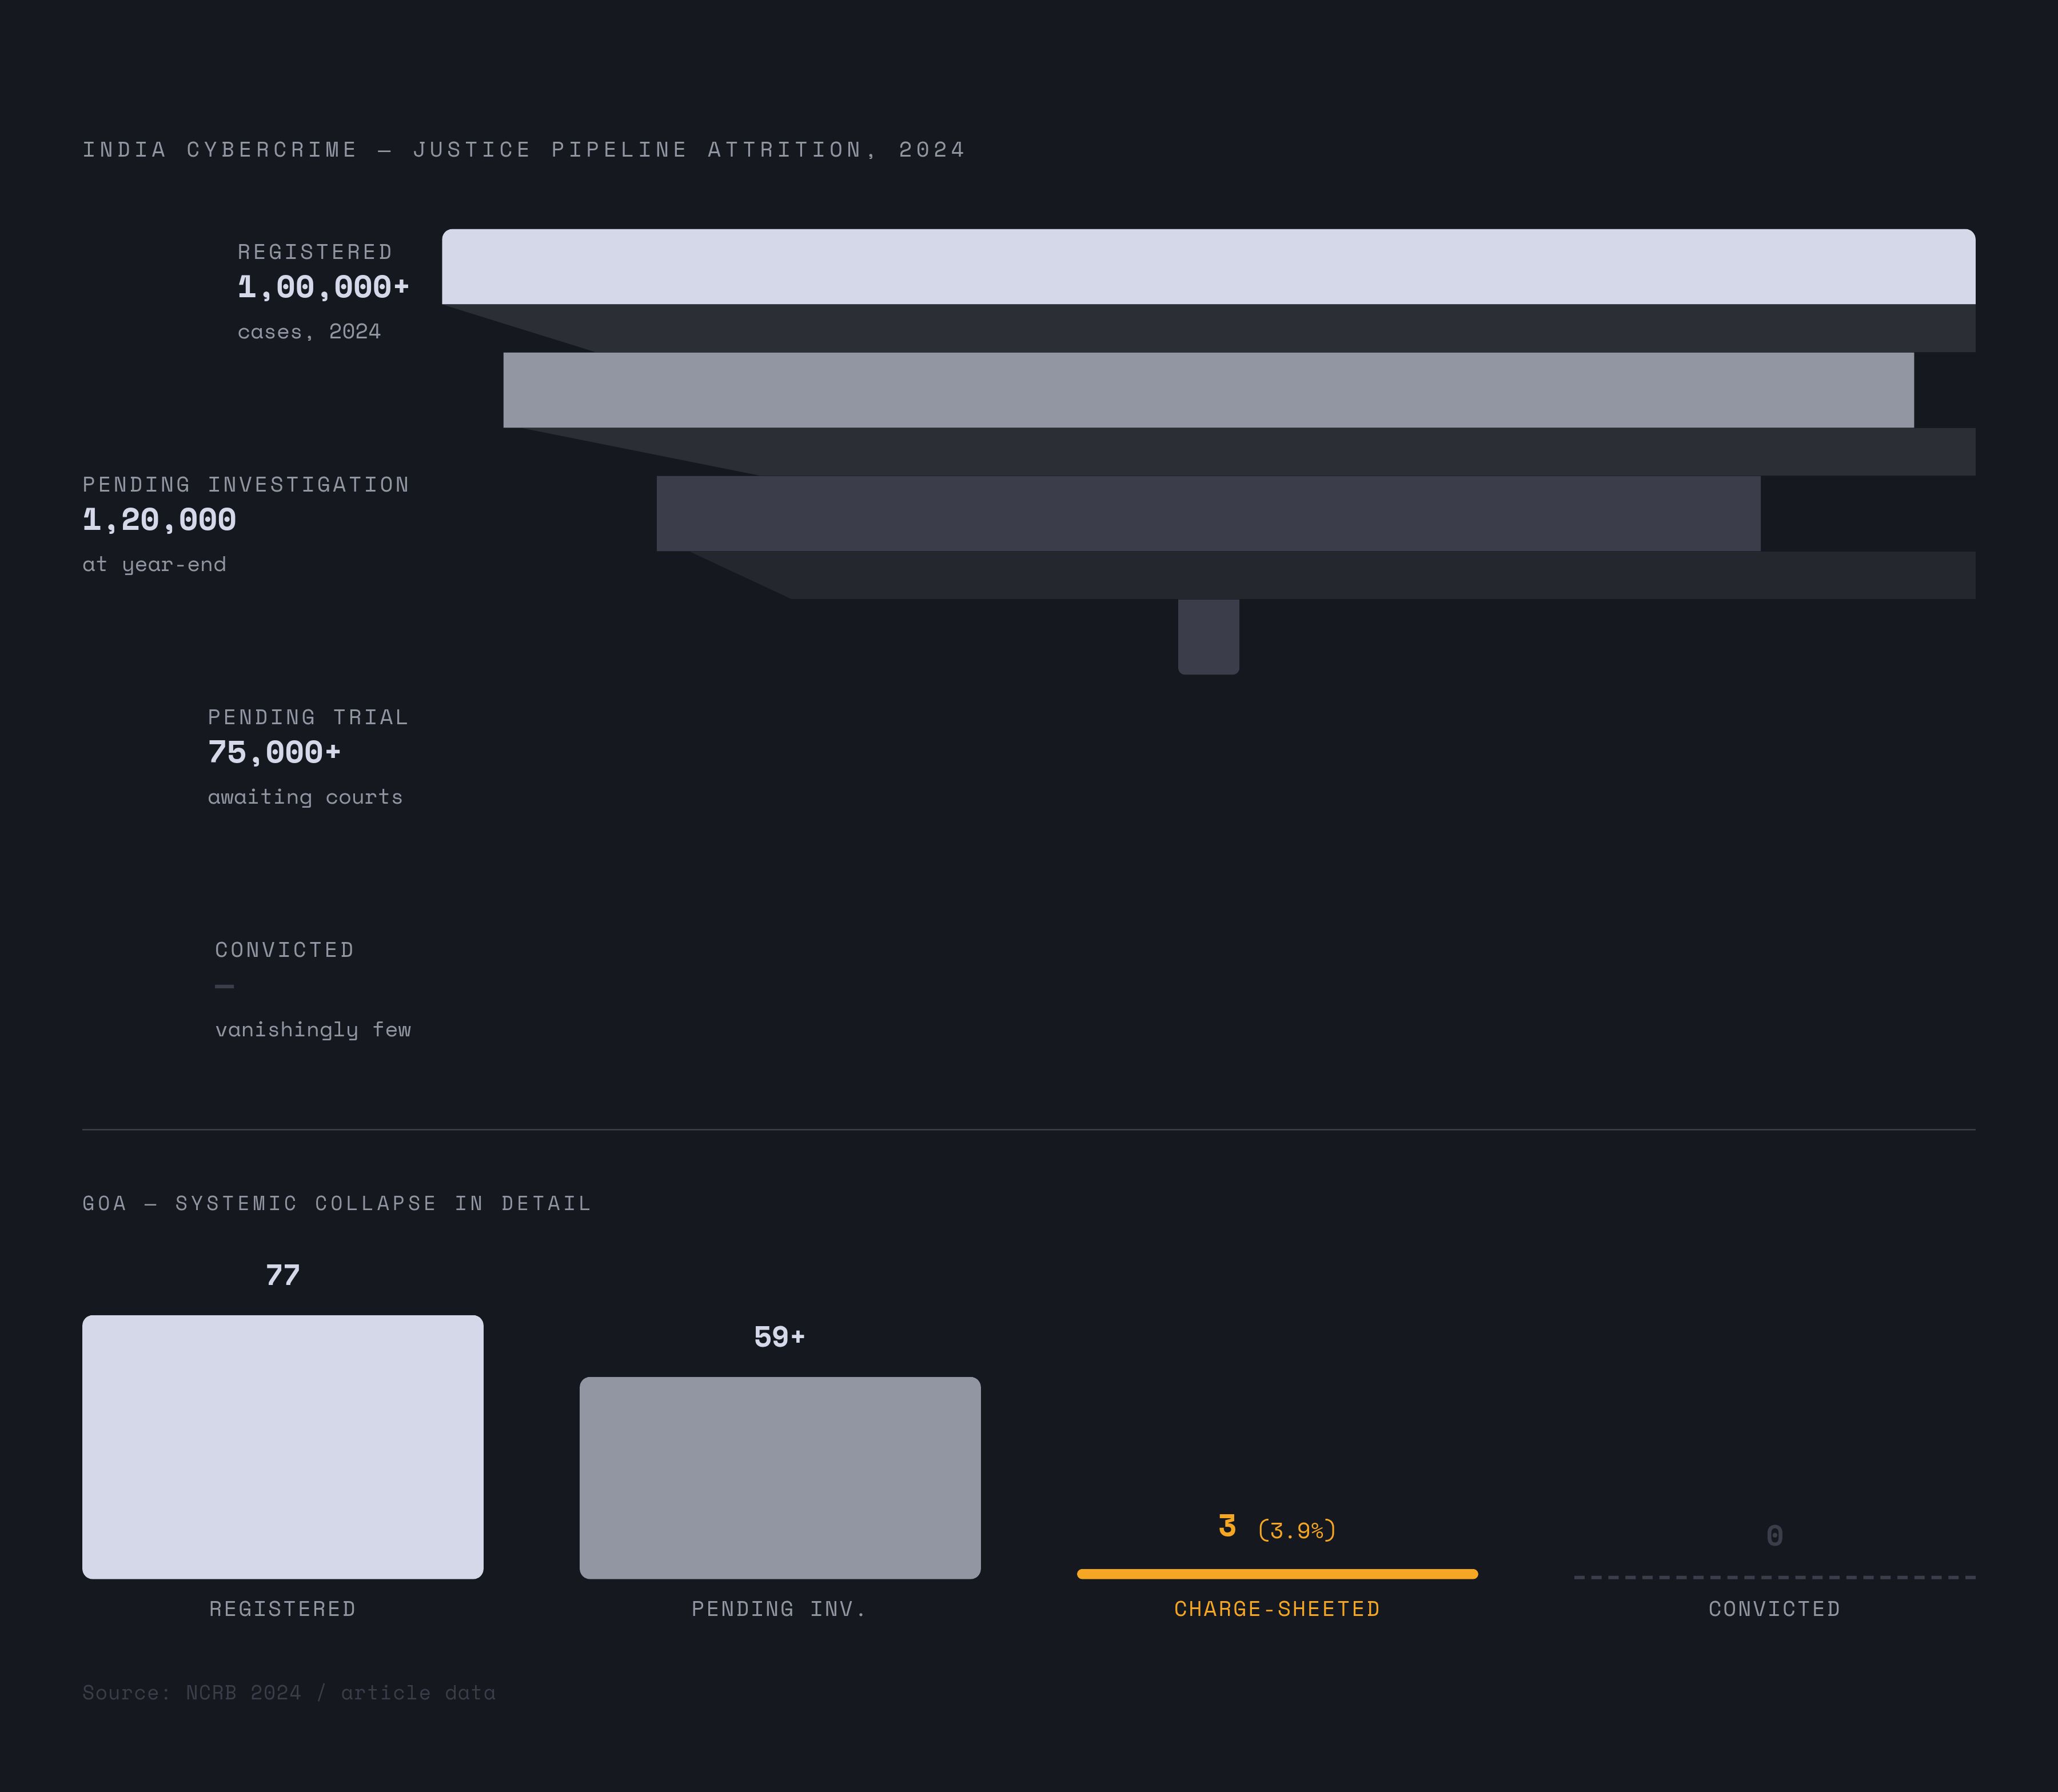
Goa gives you the clearest illustration of the conviction problem, partly because it's small enough that the numbers are precise and hard to argue with. In 2024: 77 cybercrime cases registered. Three charge-sheeted. That's a 3.9% charge-sheeting rate. Zero convictions. Over three-quarters of cases still pending investigation at year-end. You could say Goa's justice pipeline has more holes than a fishing net — and about as much luck catching anything.
Karnataka shows a similar pattern at larger scale. Conviction rates below 20%. Investigations routinely delayed. Analysts point to low conviction rates as a direct factor in offender confidence. If you're unlikely to be convicted even if caught, the risk calculus shifts.
Nationally, over 1.2 lakh cybercrime cases were pending investigation in 2024, with around 75,000 more pending trial. The pipeline is clogged.
Why? A few compounding reasons:
The IT Act 2000 was not built for this. It predates deepfakes, AI-generated fraud, and digital arrest schemes. There is no comprehensive cybercrime law or nationwide investigative protocol.
Jurisdictional fragmentation is brutal. A single fraud transaction can cross four state police jurisdictions. Mewat caller, Bengaluru victim, Kolkata mule account, Delhi ATM withdrawal. Coordinating across those jurisdictions requires state forces to share information and credit. They are structurally reluctant to do both.
The infrastructure gap is documented, not anecdotal. A CAG report found that states delayed action plans under the Police Modernisation Scheme and underutilised funds meant for cyber forensic lab upgrades.
This is not a capacity problem that snuck up on anyone. It's been visible in audit findings. The bottleneck has been acting on what's already known.
The Central Coordination Tools Trying to Bridge the Gap
I4C has built a reasonably impressive toolkit. Pratibimb for geospatial arrest support. Samanvay for cross-jurisdiction data sharing. A Suspect Registry built in partnership with banks and the RBI. The Registry has received over 18.43 lakh suspect identifiers from banks, and shared over 24.67 lakh Layer 1 mule accounts, contributing to declining transactions worth over ₹8,031 crore.
The NCRP and the Citizen Financial Cyber Fraud Reporting and Management System together have helped prevent losses exceeding ₹11,158 crore across more than 32.80 lakh complaints up to mid-2026. That's a real outcome.
On the workforce side: over 1.63 lakh police personnel and judicial officers have registered on the CyTrain platform. 281 specialised Cyber Commandos have been trained since late 2024. In absolute terms, that's modest against the scale of the problem and the backlog at 459 dedicated cyber police stations across the country. But it's movement.
I4C and Microsoft have blocked over 1,000 Skype IDs used in digital arrest scams. MHA has blocked hundreds of thousands of SIM cards and WhatsApp accounts tied to networks in Cambodia, Myanmar, and Laos.
The mechanisms exist. They're functioning. The bottleneck is state-level uptake. Central tools surface intelligence. State police have to act on it. That last step is where things slow down.
Reading the Map: What the Disparities Actually Tell You
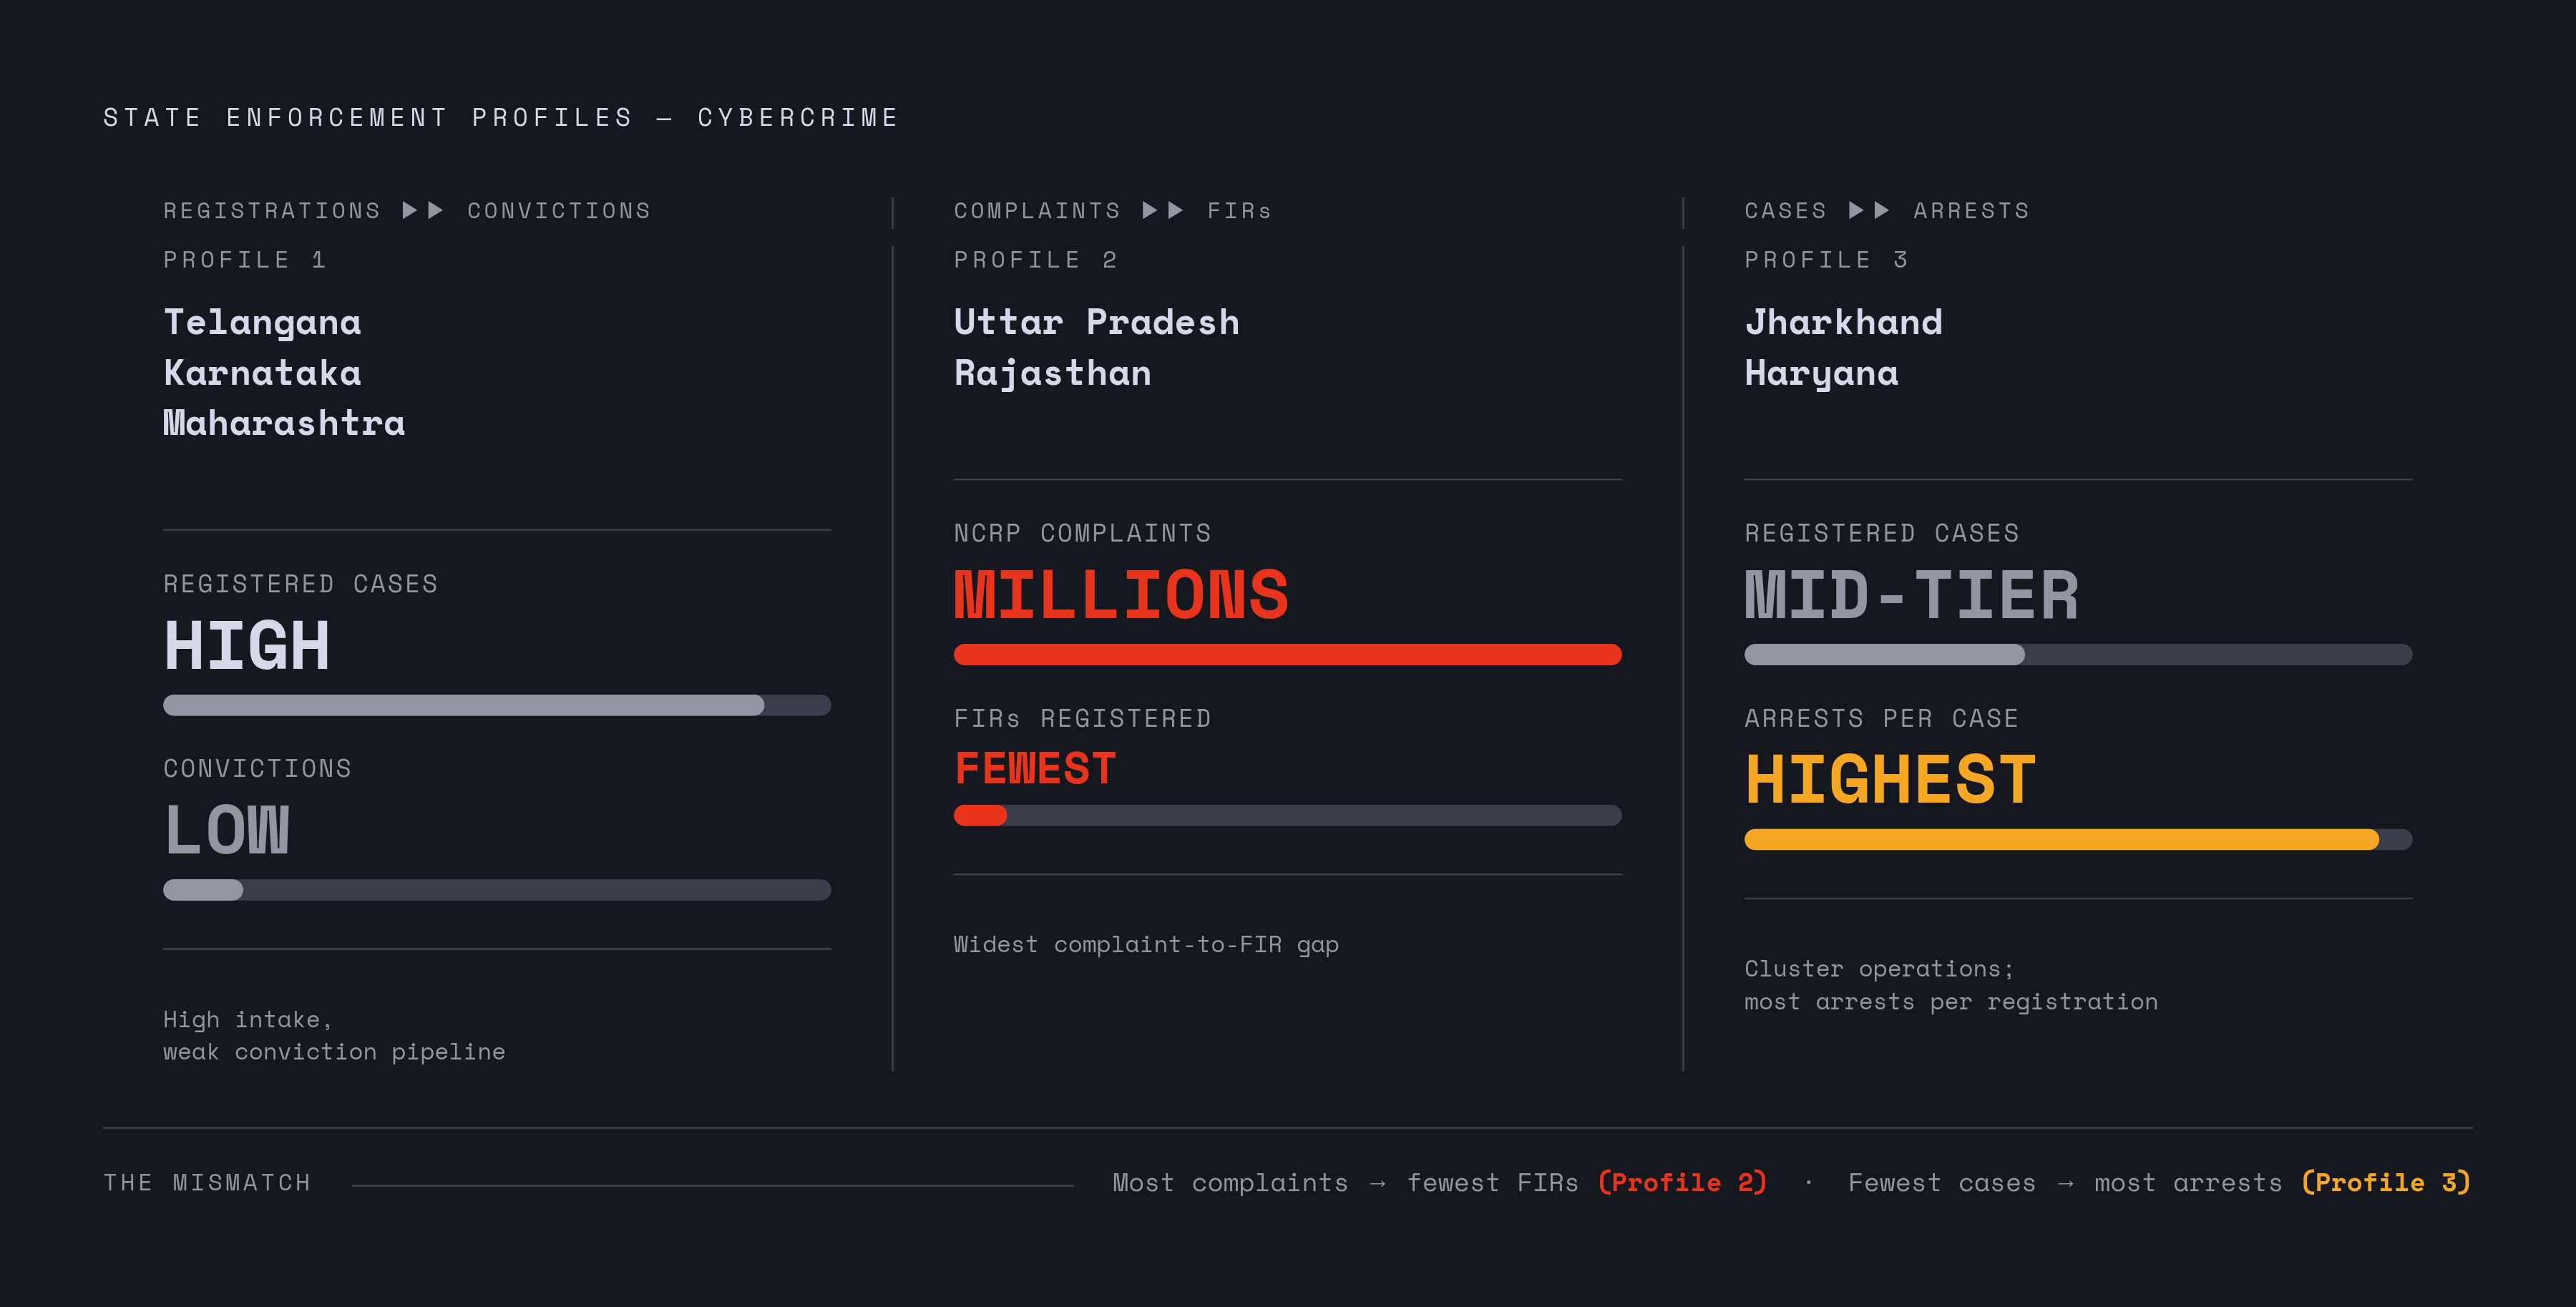
Three distinct state profiles emerge when you look at all of this together.
High-registration states (Telangana, Karnataka, Maharashtra): Case volumes are real and reflect genuine crime activity in major digital economies. But conviction pipelines are weak, and the gap between registered cases and successful prosecutions is wide.
High-complaint, low-registration states (Uttar Pradesh, Rajasthan): The gap between citizen reporting and formal FIRs is largest here. Millions of complaints. Comparatively few FIRs. This is where under-registration and capacity failure are most visible.
Enforcement-active hotspot states (Jharkhand, Haryana): Mid-tier in NCRB case rankings. High-intensity in targeted cluster operations. Arrests happen here because enforcement is organised around geography and criminal networks, not just case volume.
The national 17.9% rise in registered cases is partly a registration improvement story. Better systems in digitally mature states are capturing more of what was always happening.
The crime mix is also shifting in a direction that makes prosecution harder. Investment scams accounted for 76% of total money lost and 35% of all reported cases in recent data. Digital arrest scams grew from around 39,925 incidents in 2022 to over 1,23,672 in 2024, with associated losses rising from roughly ₹91 crore to over ₹1,935 crore. Higher-value, harder-to-prosecute schemes. Exactly the type that strains conviction rates further.
The only way to assess which states are genuinely converting enforcement capacity into outcomes is to map arrest activity against case registration and complaint volume together. Every metric tells only part of the story. The data architecture itself compounds this: NCRB FIR data, NCRP complaint data, and parliamentary arrest annexures live in separate places, maintained separately, published separately. A clean cross-state enforcement picture requires combining all three sources.
Until that changes, the national headline numbers will keep getting cited without the context that makes them meaningful. And the states doing the actual enforcement work, and the states quietly doing nothing, will keep looking the same from a distance.